Recipes#
Each recipe below is a complete slide, not a fragment: copy it, replace the words, and it renders. Every one of them is taken from the recipes presentation on the website, so what you see here is what the layout checker accepts.
Open the recipes presentation to see the rendered result, and read its source to see the recipes in order.
- Cover
- One idea and its evidence
- Comparison
- A row of measurements
- Code beside its explanation
- A formula with its reading
- A flow diagram
- A two-dimensional architecture
- Progressive reveal
- Closing statement
Cover#
slide({ name: "Cover" }).cover();
text("Section 01").eyebrow();
text("Adaptive Inference at the Edge").hero();
text("Routing easy inputs away from the network").subtitle();
text("Research Systems Group").author();
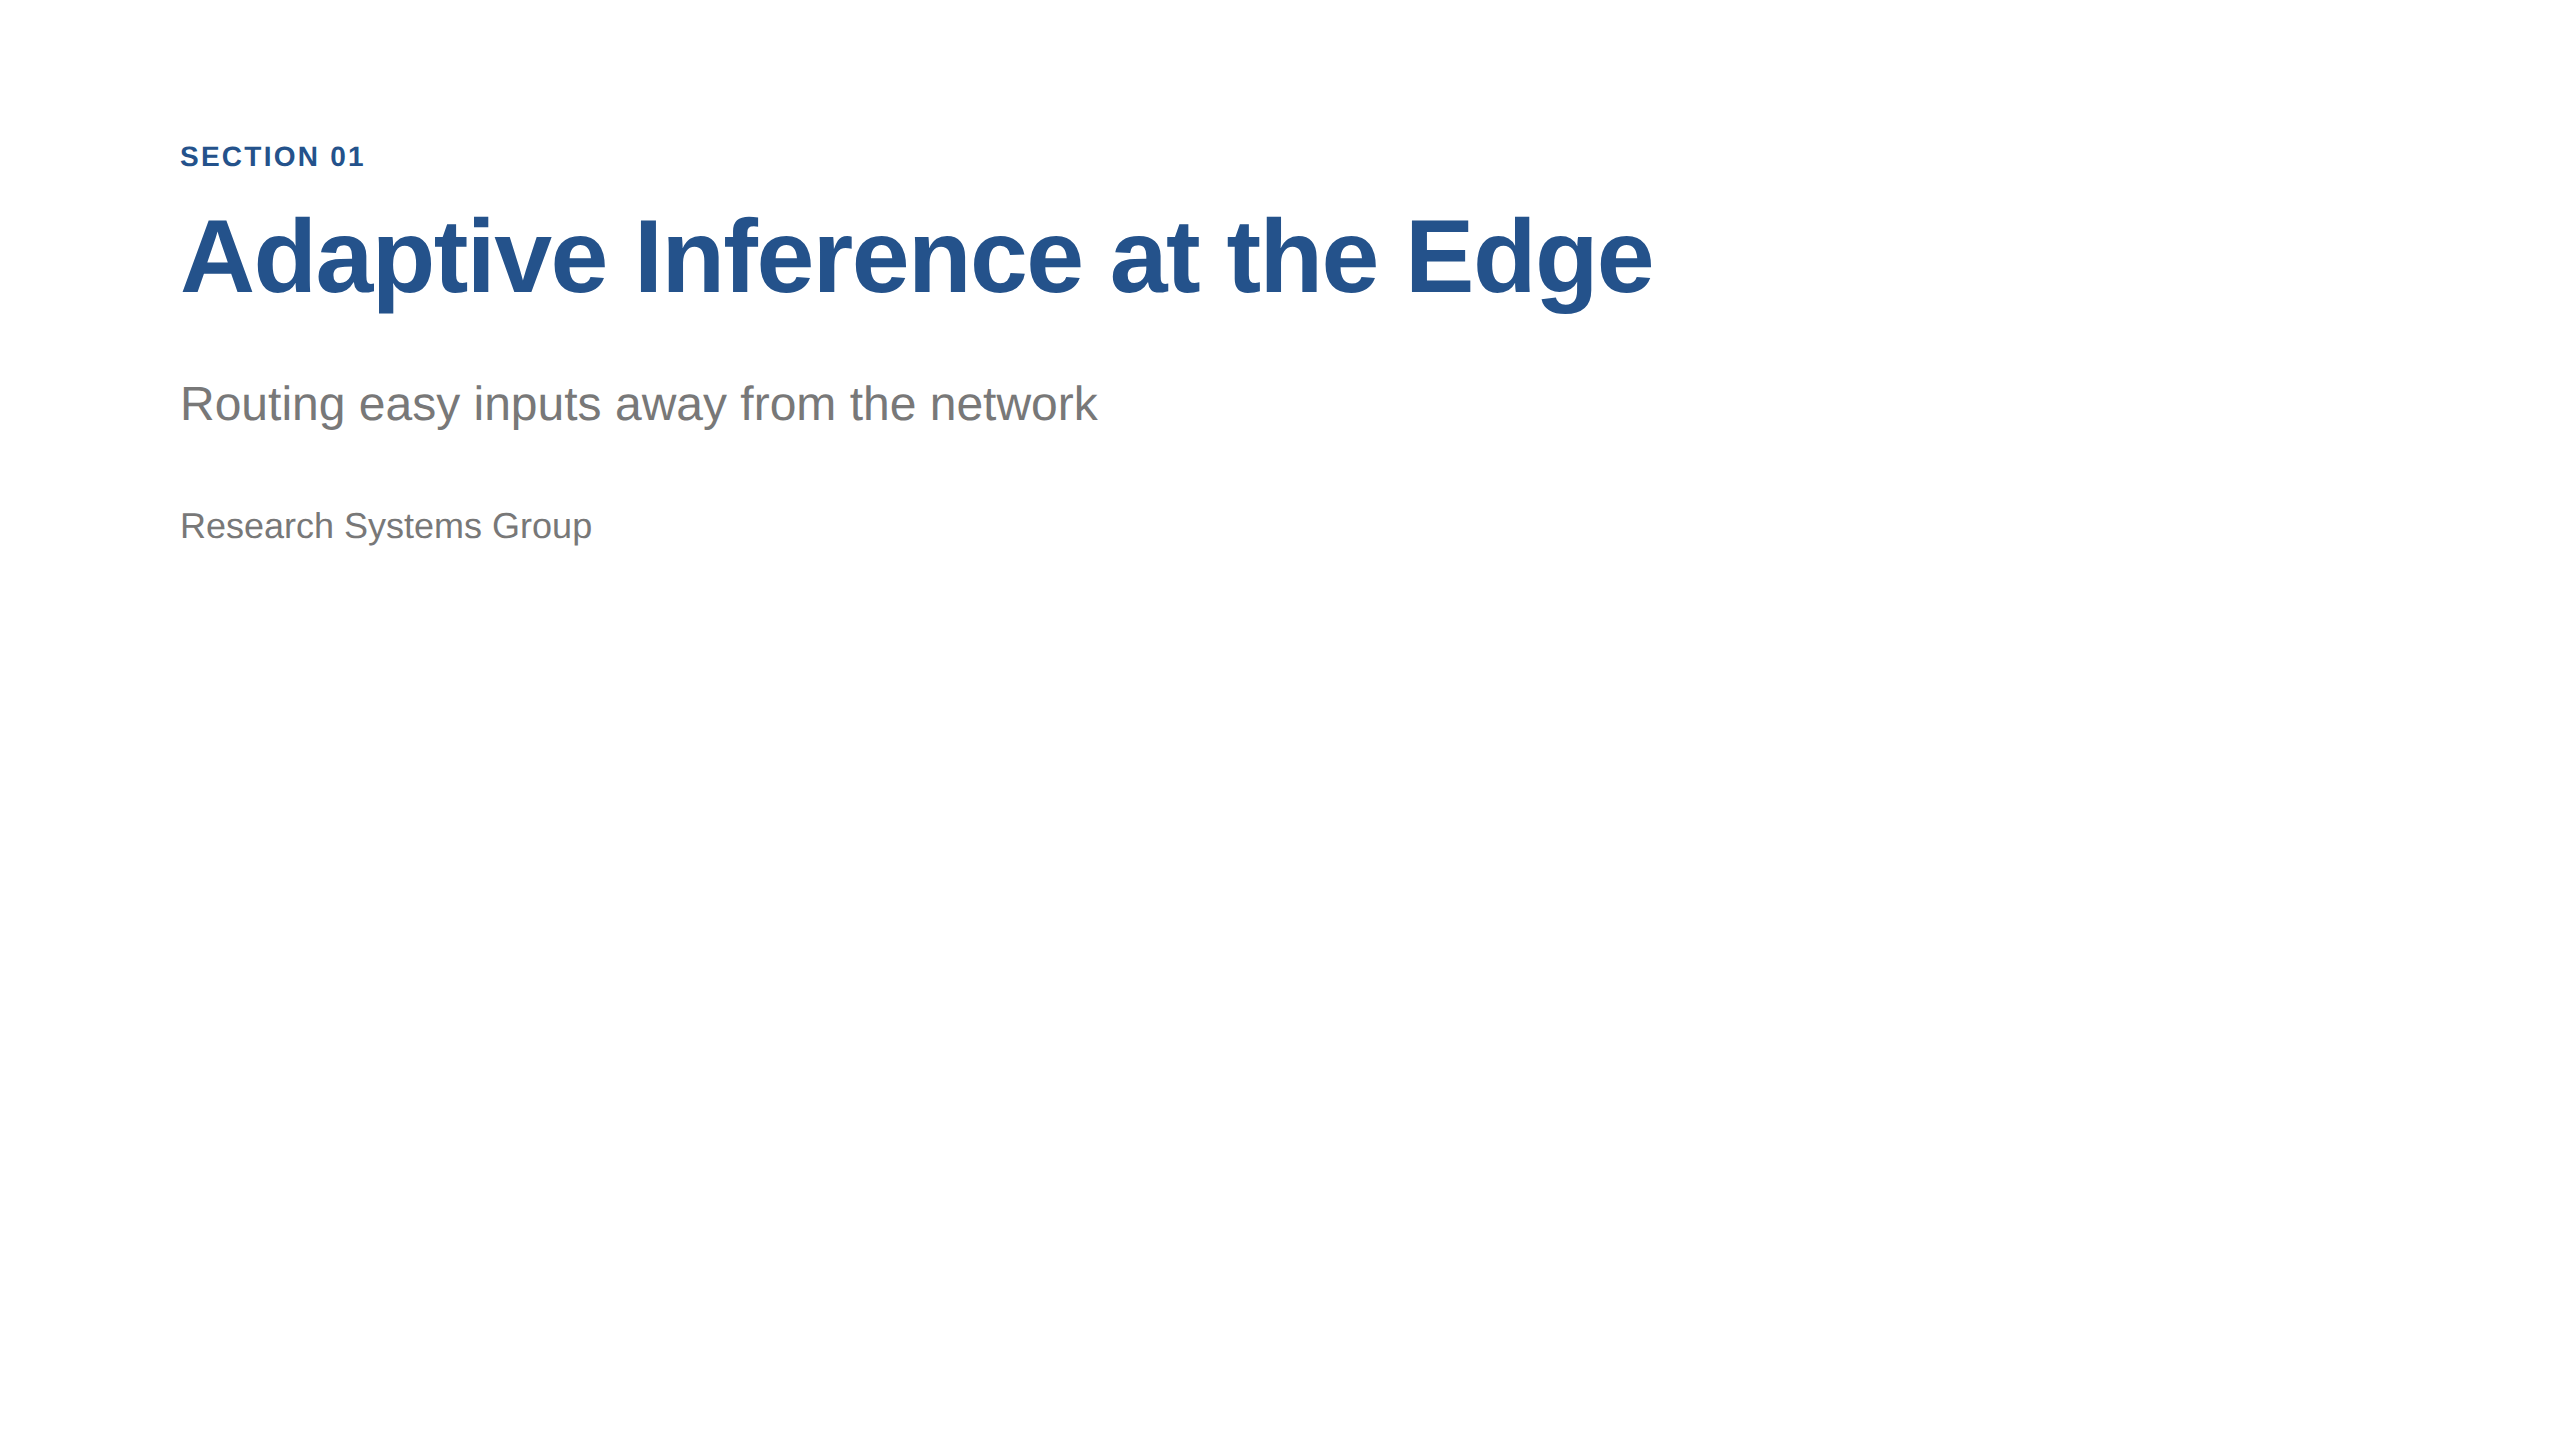
cover() changes the layout; the four text roles carry the meaning. Nothing here sets a font size, so a change of theme restyles the page without touching it.
One idea and its evidence#
slide("Cloud-only inference stalls on the network");
text("The round trip costs more than the model call it protects.").lead();
bullets(
  "Latency varies with congestion, not with model size",
  "Every input leaves the device, including private ones",
  "A fixed route spends the same budget on easy and hard inputs",
);
note("Give the audience the problem before the method.");
text("Measurements in these slides are illustrative.").caption();
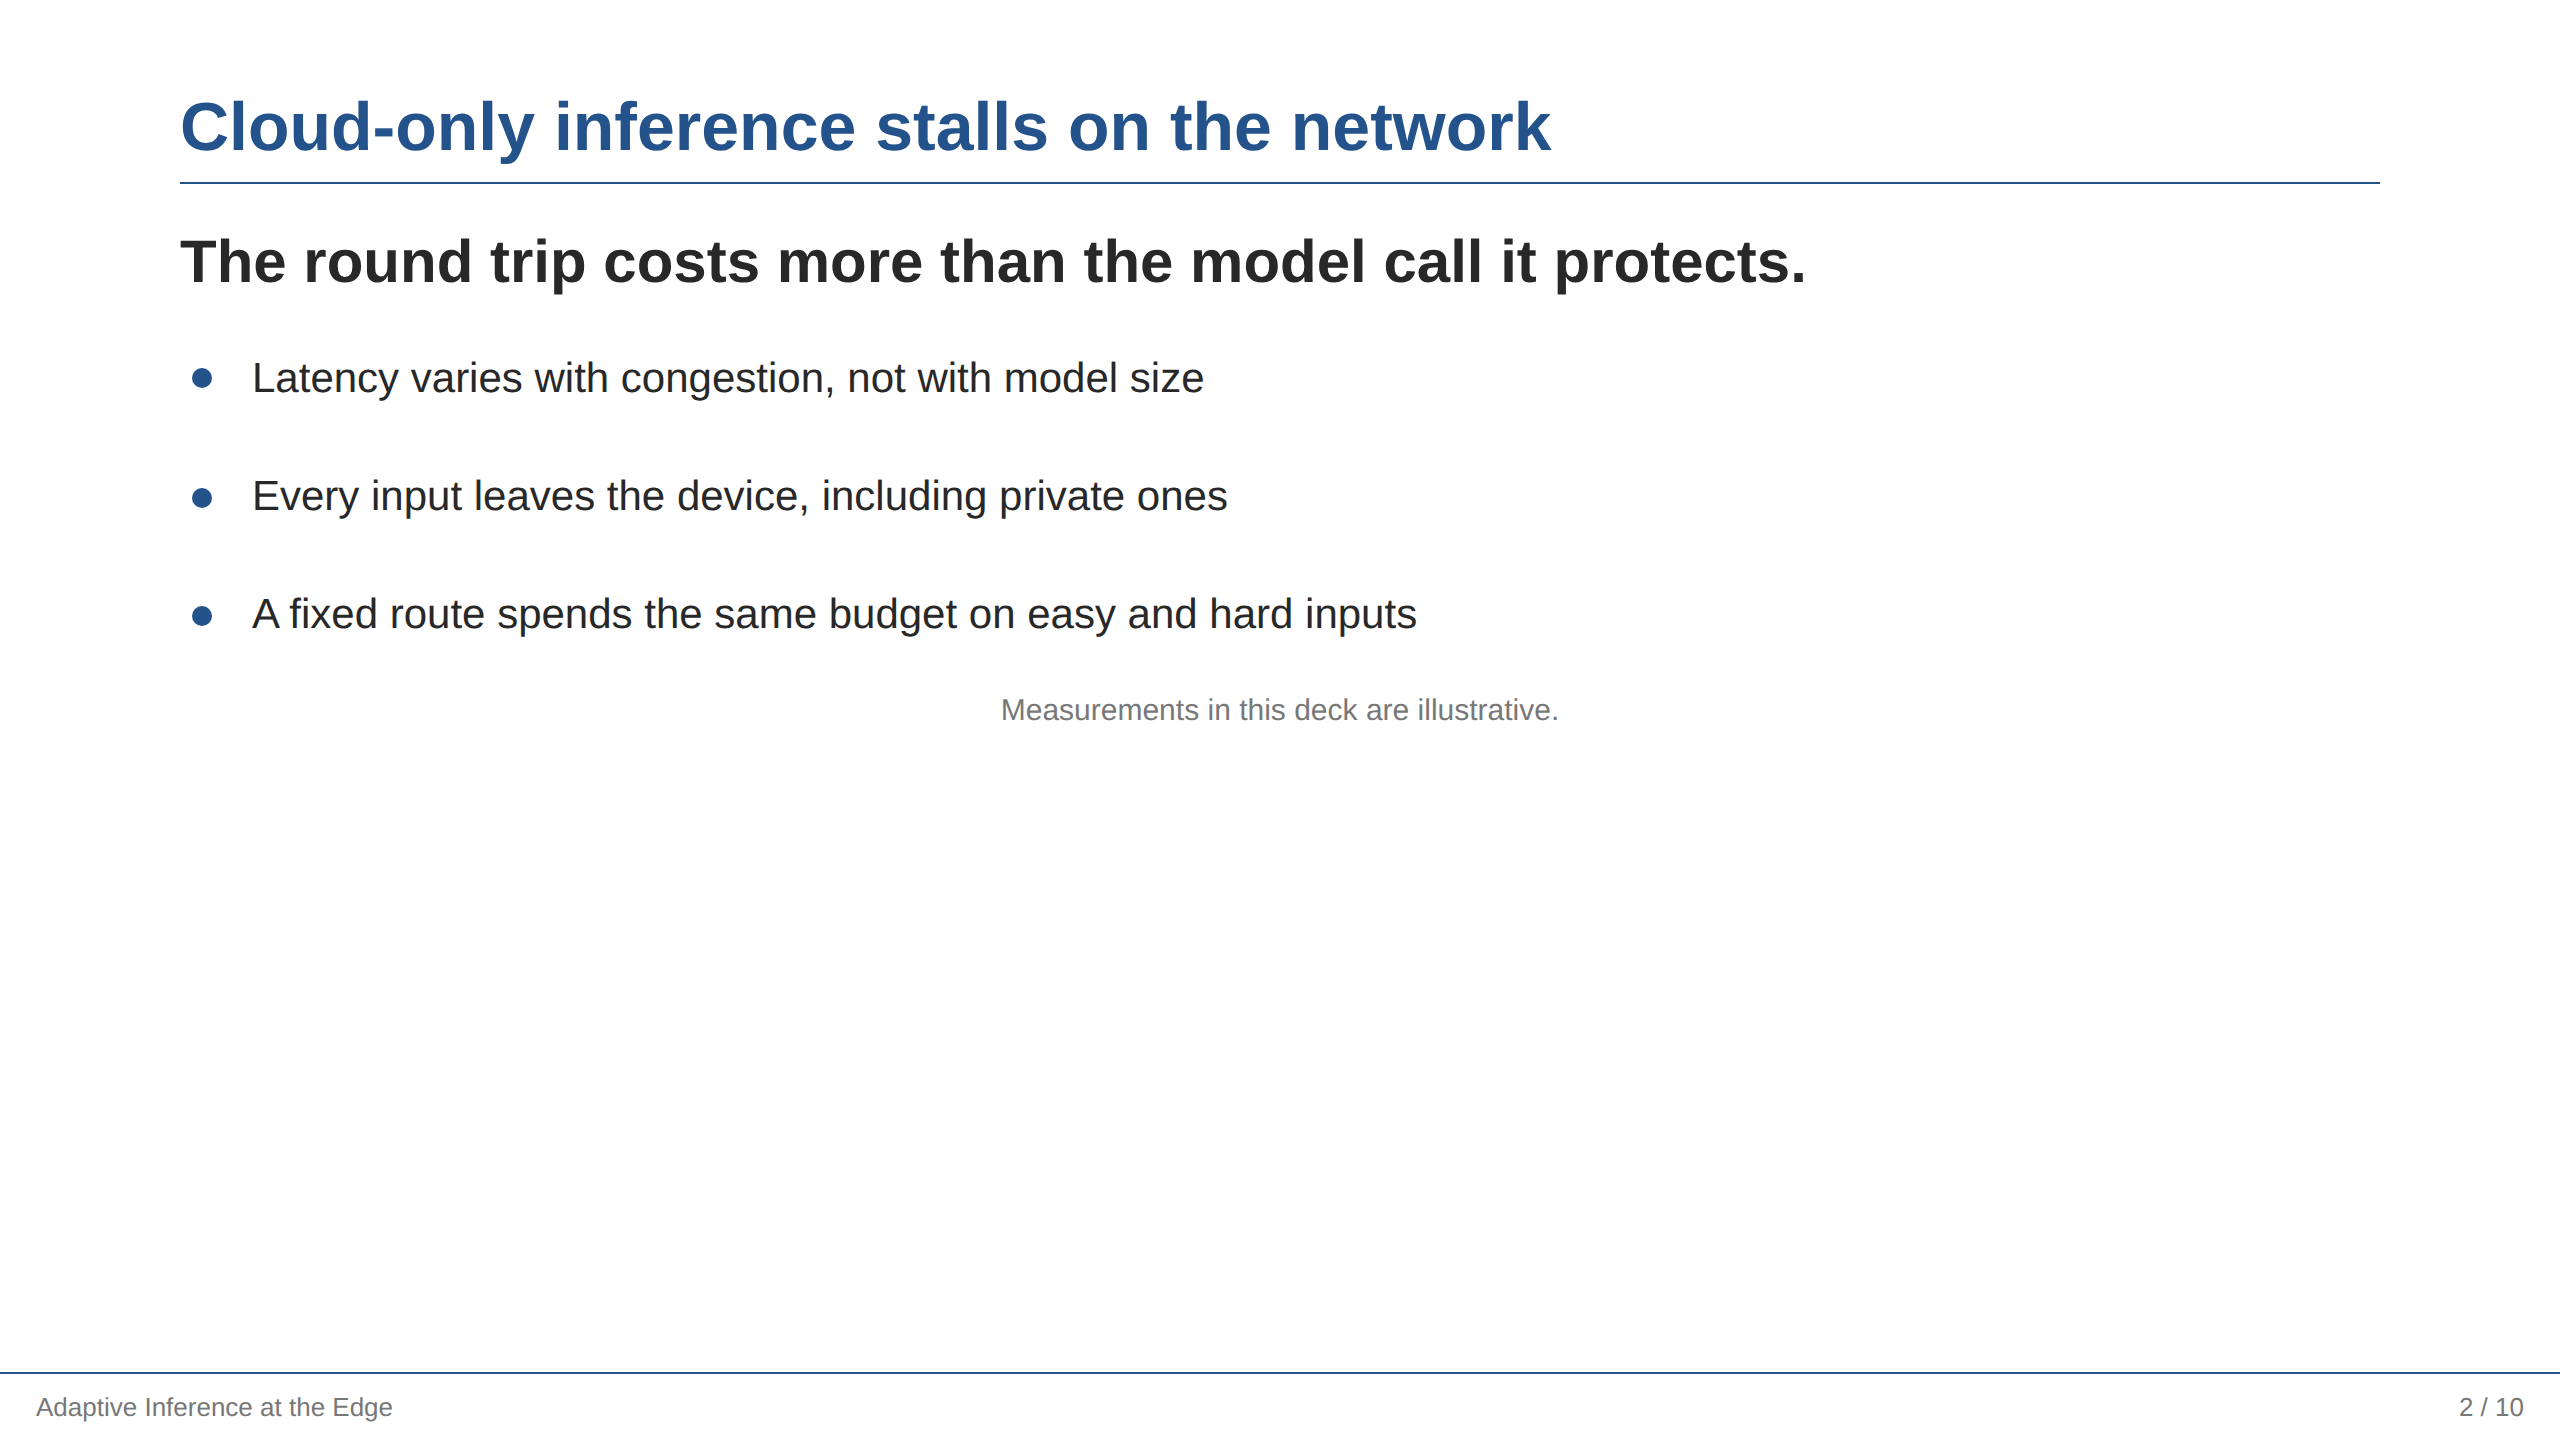
The most common slide in a talk. The title states the claim, lead() states it once more in a sentence, and the bullets are the evidence. note() keeps the delivery detail off the screen, and caption() is where a disclaimer belongs.
Comparison#
slide("Two routes, one budget").split("45:55");
text("Cloud only").lead();
bullets("118 ms round trip", "Every input uploaded", "One accuracy operating point");

right();
text("Adaptive").lead();
bullets("41 ms for routed inputs", "72% stay on the device", "Accuracy traded per input");
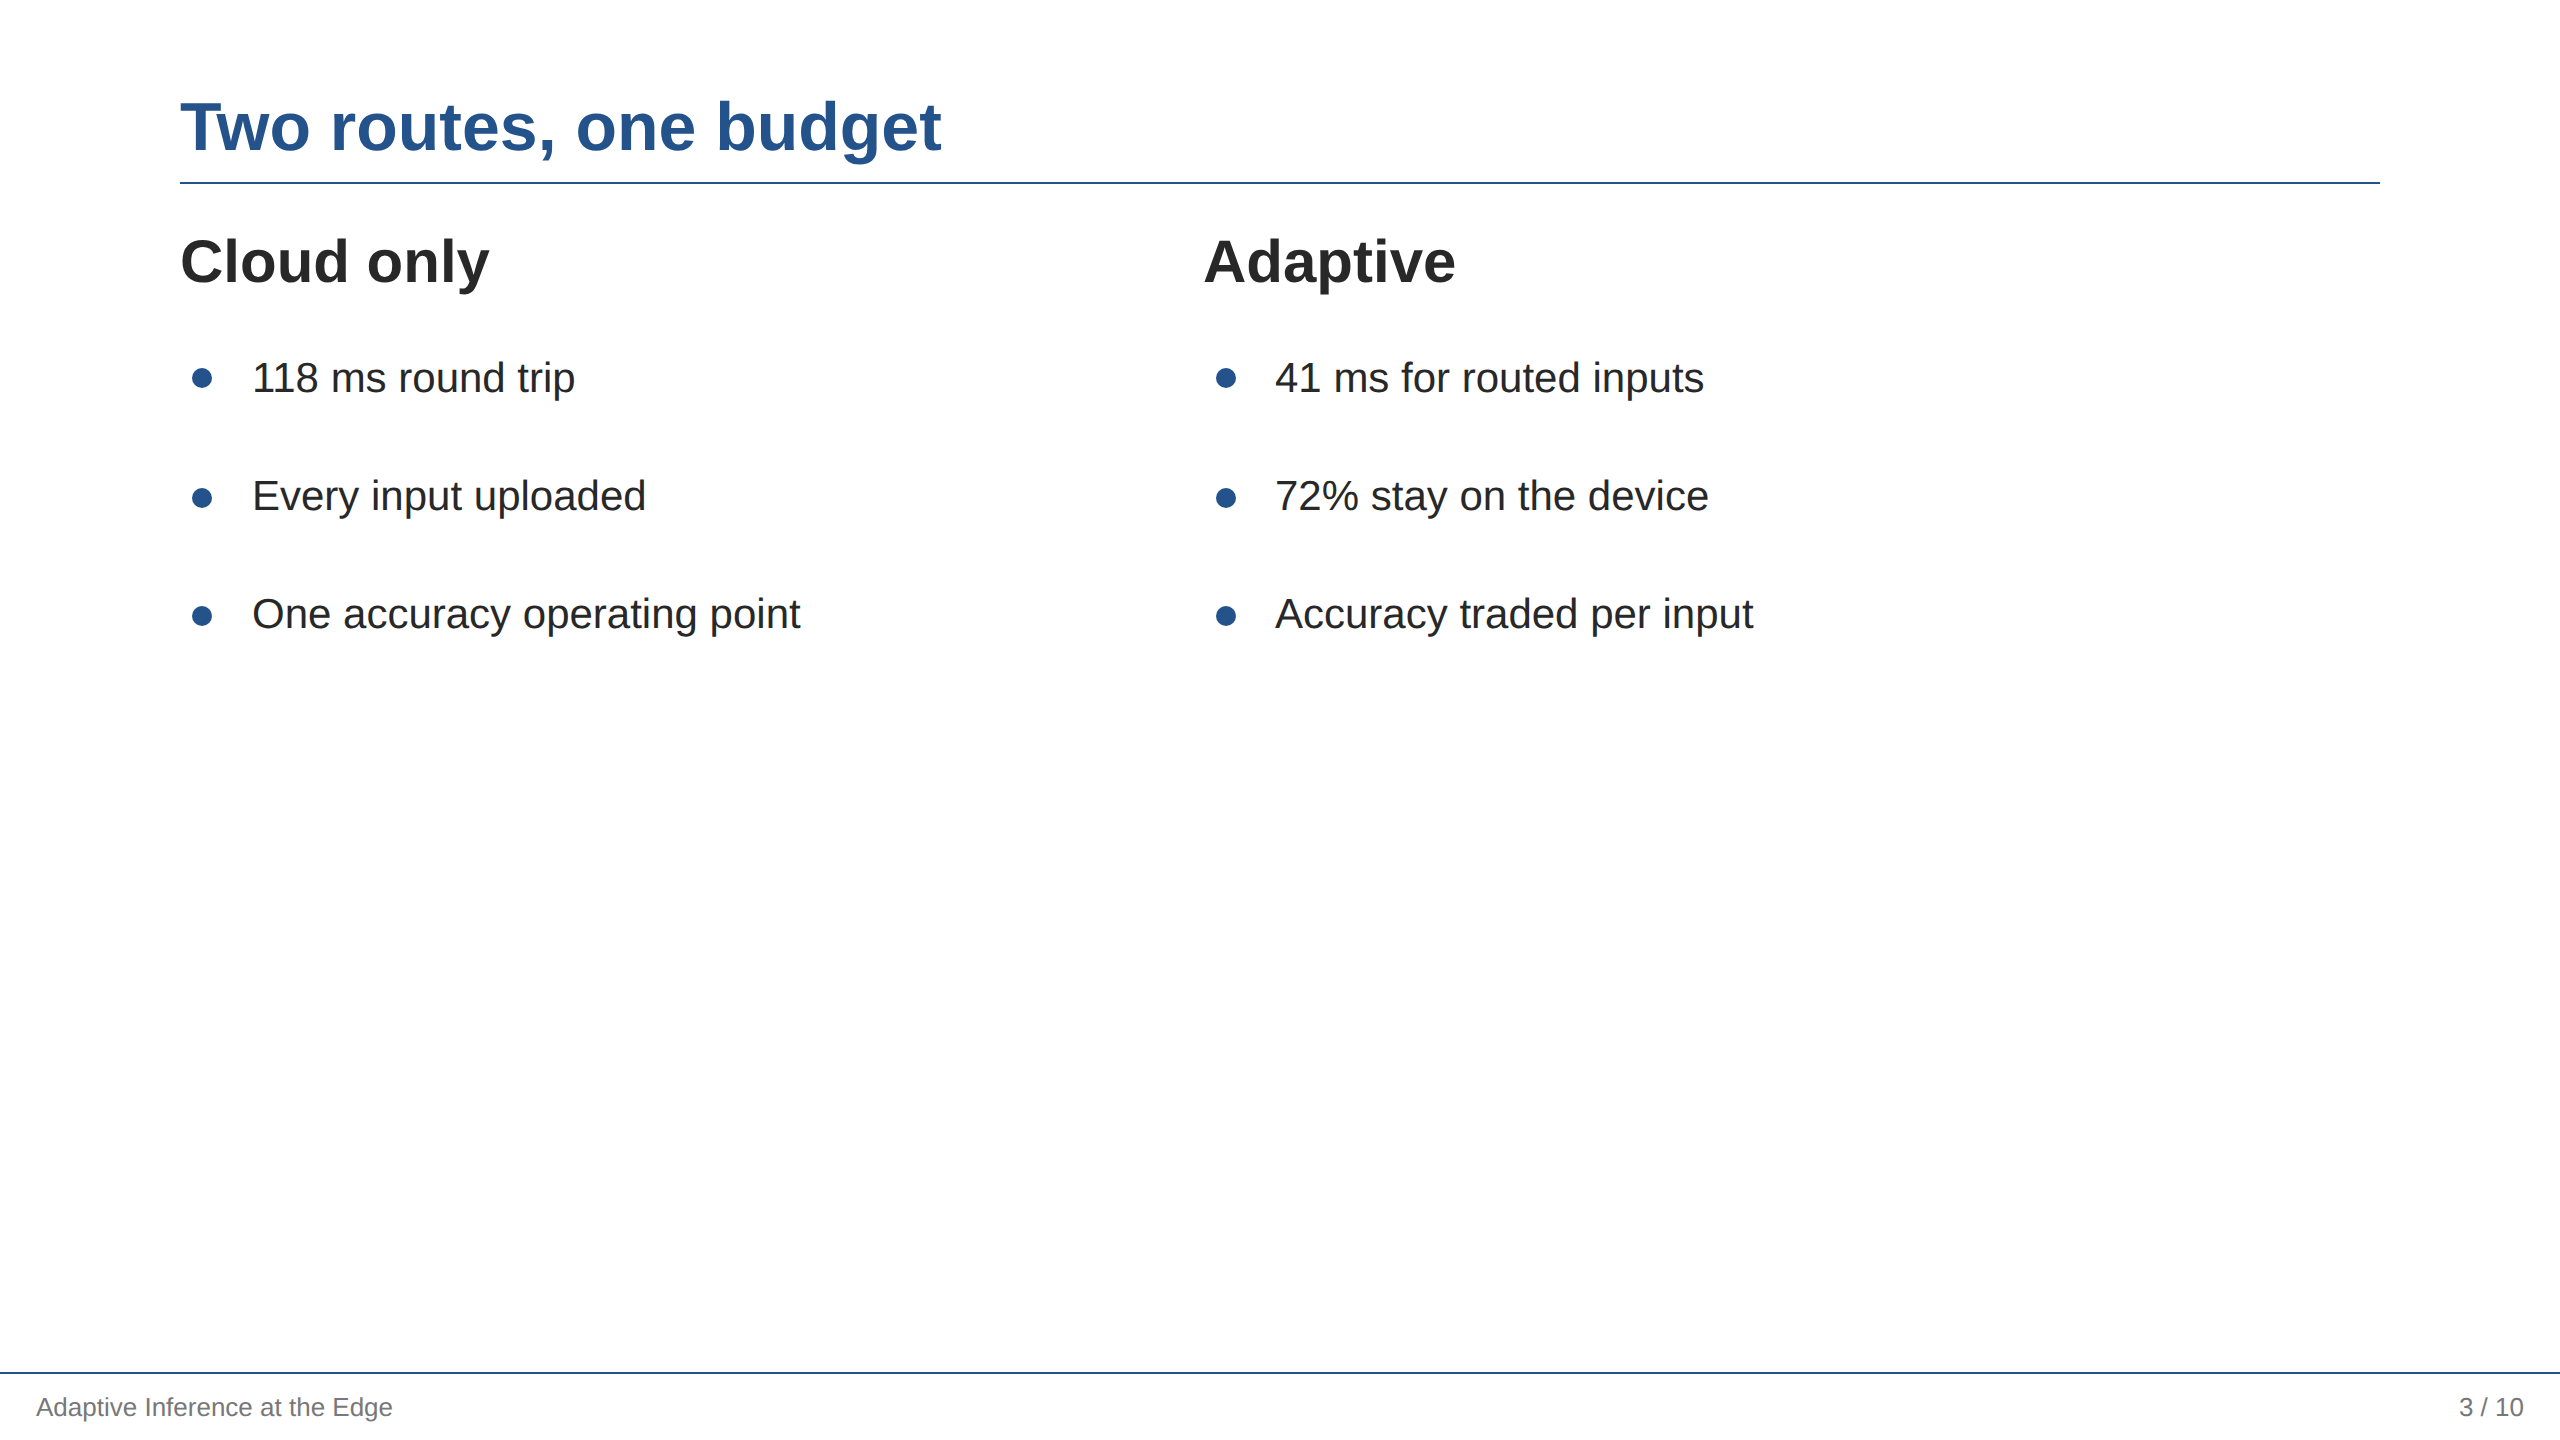
split() names two regions and right() moves to the second, so the two sides stay side by side in the source as well as on the page. Keep the two lists the same length; the shape of the slide is the argument.
A row of measurements#
slide("Operating profile");
text("Three numbers summarise the run.");
gridSection(
  3,
  metric("41 ms", "Median latency"),
  metric("72%", "Inputs kept local"),
  metric("−0.6 pt", "Accuracy change"),
).gap(20);
text("Values are illustrative and not a benchmark.").caption();
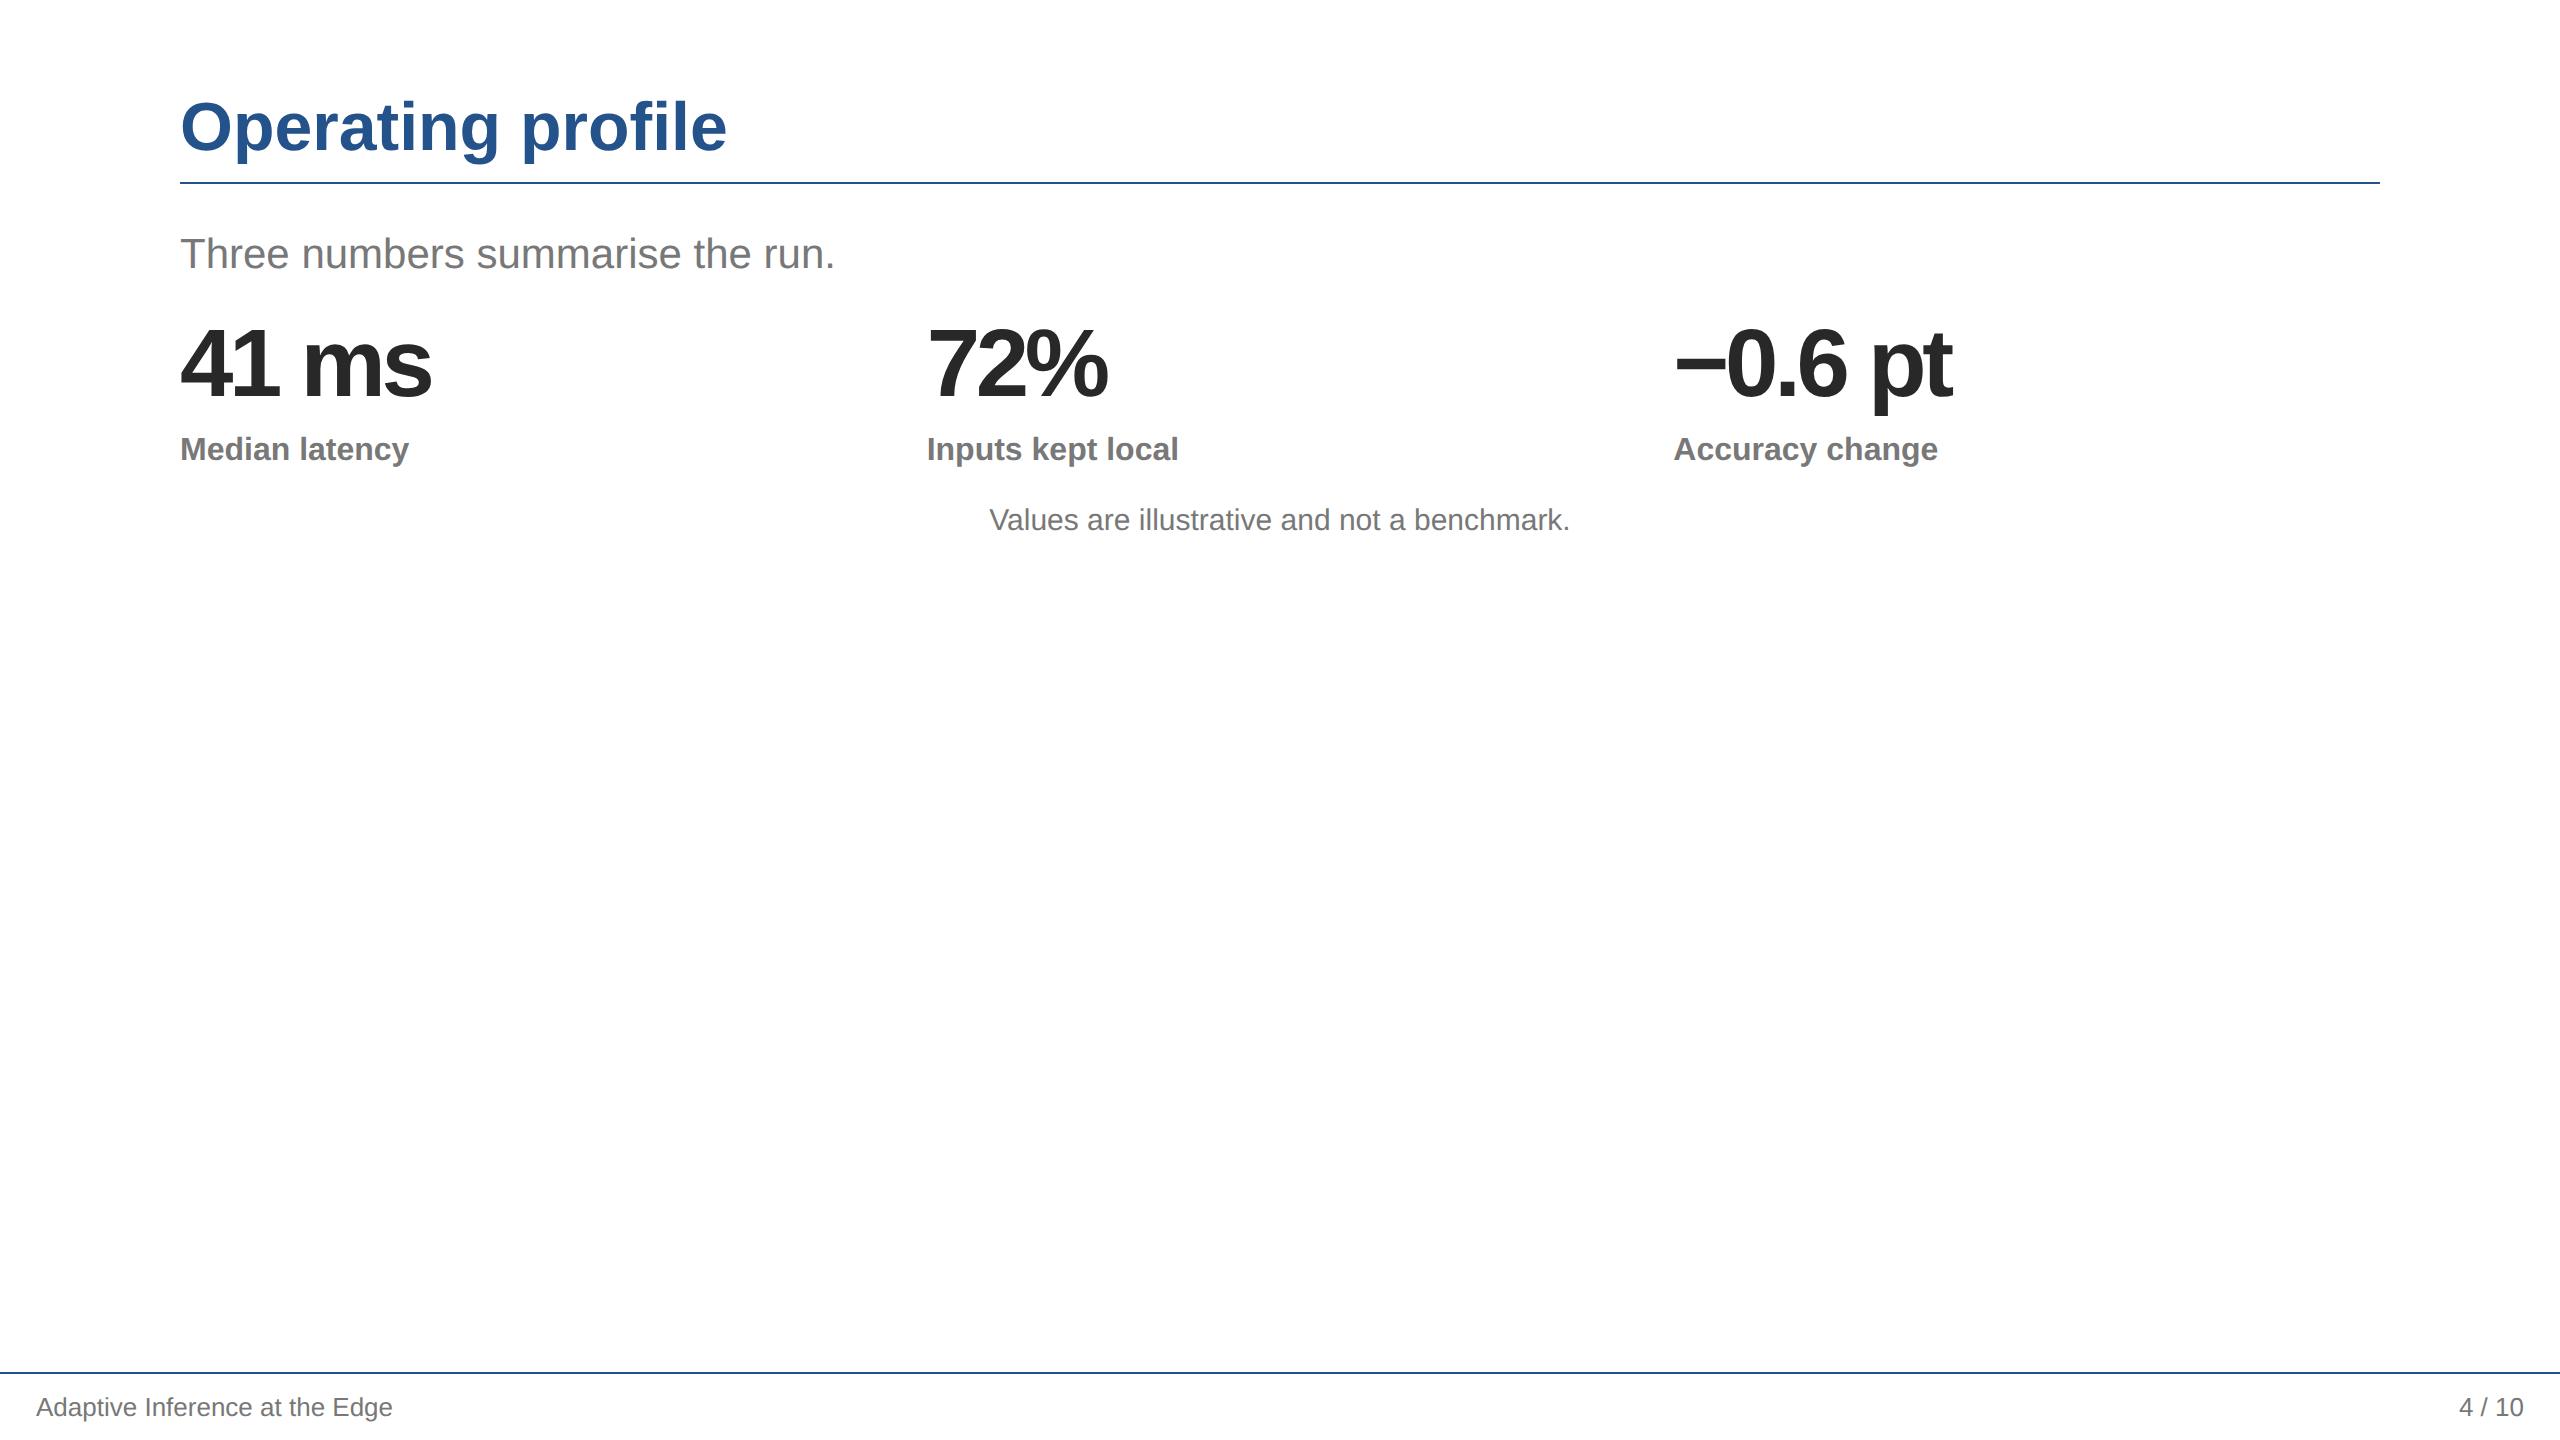
gridSection() arranges only its own items, so the sentence above and the caption below stay in the ordinary flow. Use slide().grid(3) instead when the whole page is the grid.
Code beside its explanation#
slide("The routing rule").split("52:48");
code(`if (confidence(small) >= threshold) {
  return small;
}
return large;`, "ts");

right();
text("One comparison decides the route.").lead();
bullets(
  "The small model always runs first",
  "Only its confidence crosses the network",
  "The threshold is the single tuning knob",
);
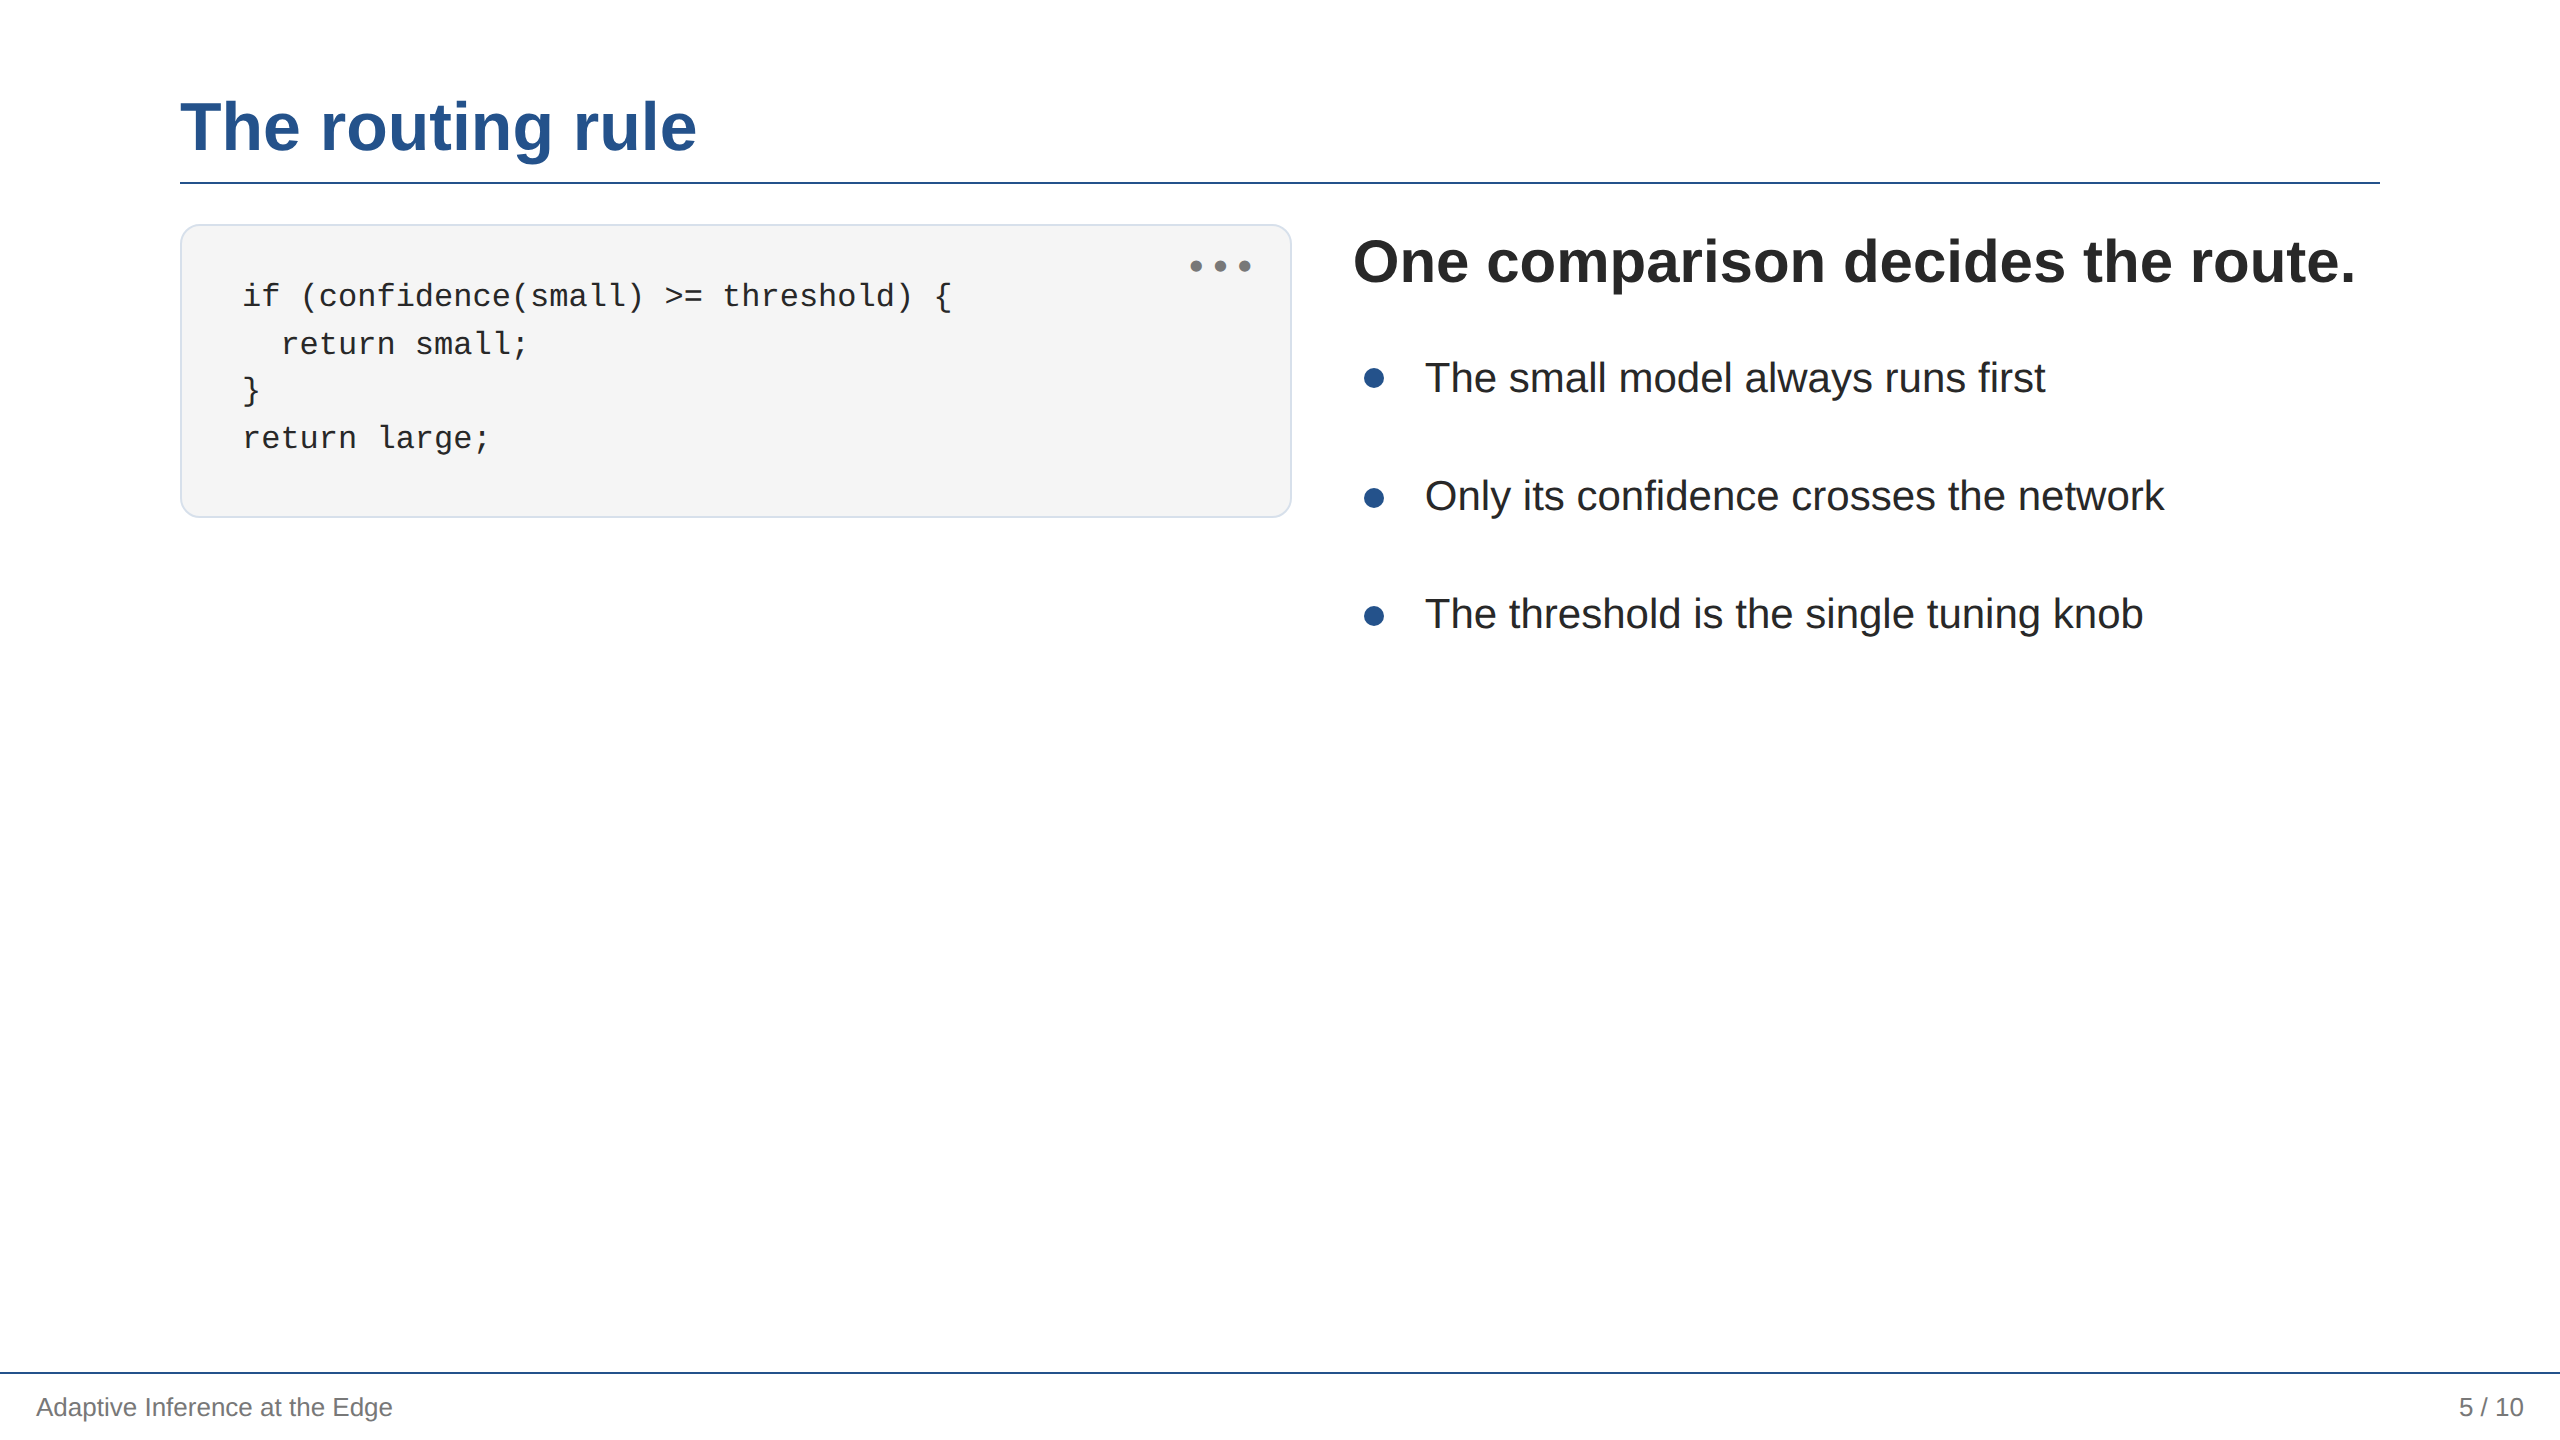
Give the code slightly more than half the width and cut it down to the lines that carry the idea. The bullets say what the reader should notice, which is not the same as narrating the code.
A formula with its reading#
slide("Objective").center();
text`The router minimises latency subject to an accuracy floor.`.lead();
math`\min_{\theta}\; \mathbb{E}\big[\ell(f_\theta(x), y)\big] + \lambda\,\mathbb{E}\big[c(x)\big]`;
text("λ prices a millisecond against a point of accuracy.").caption();
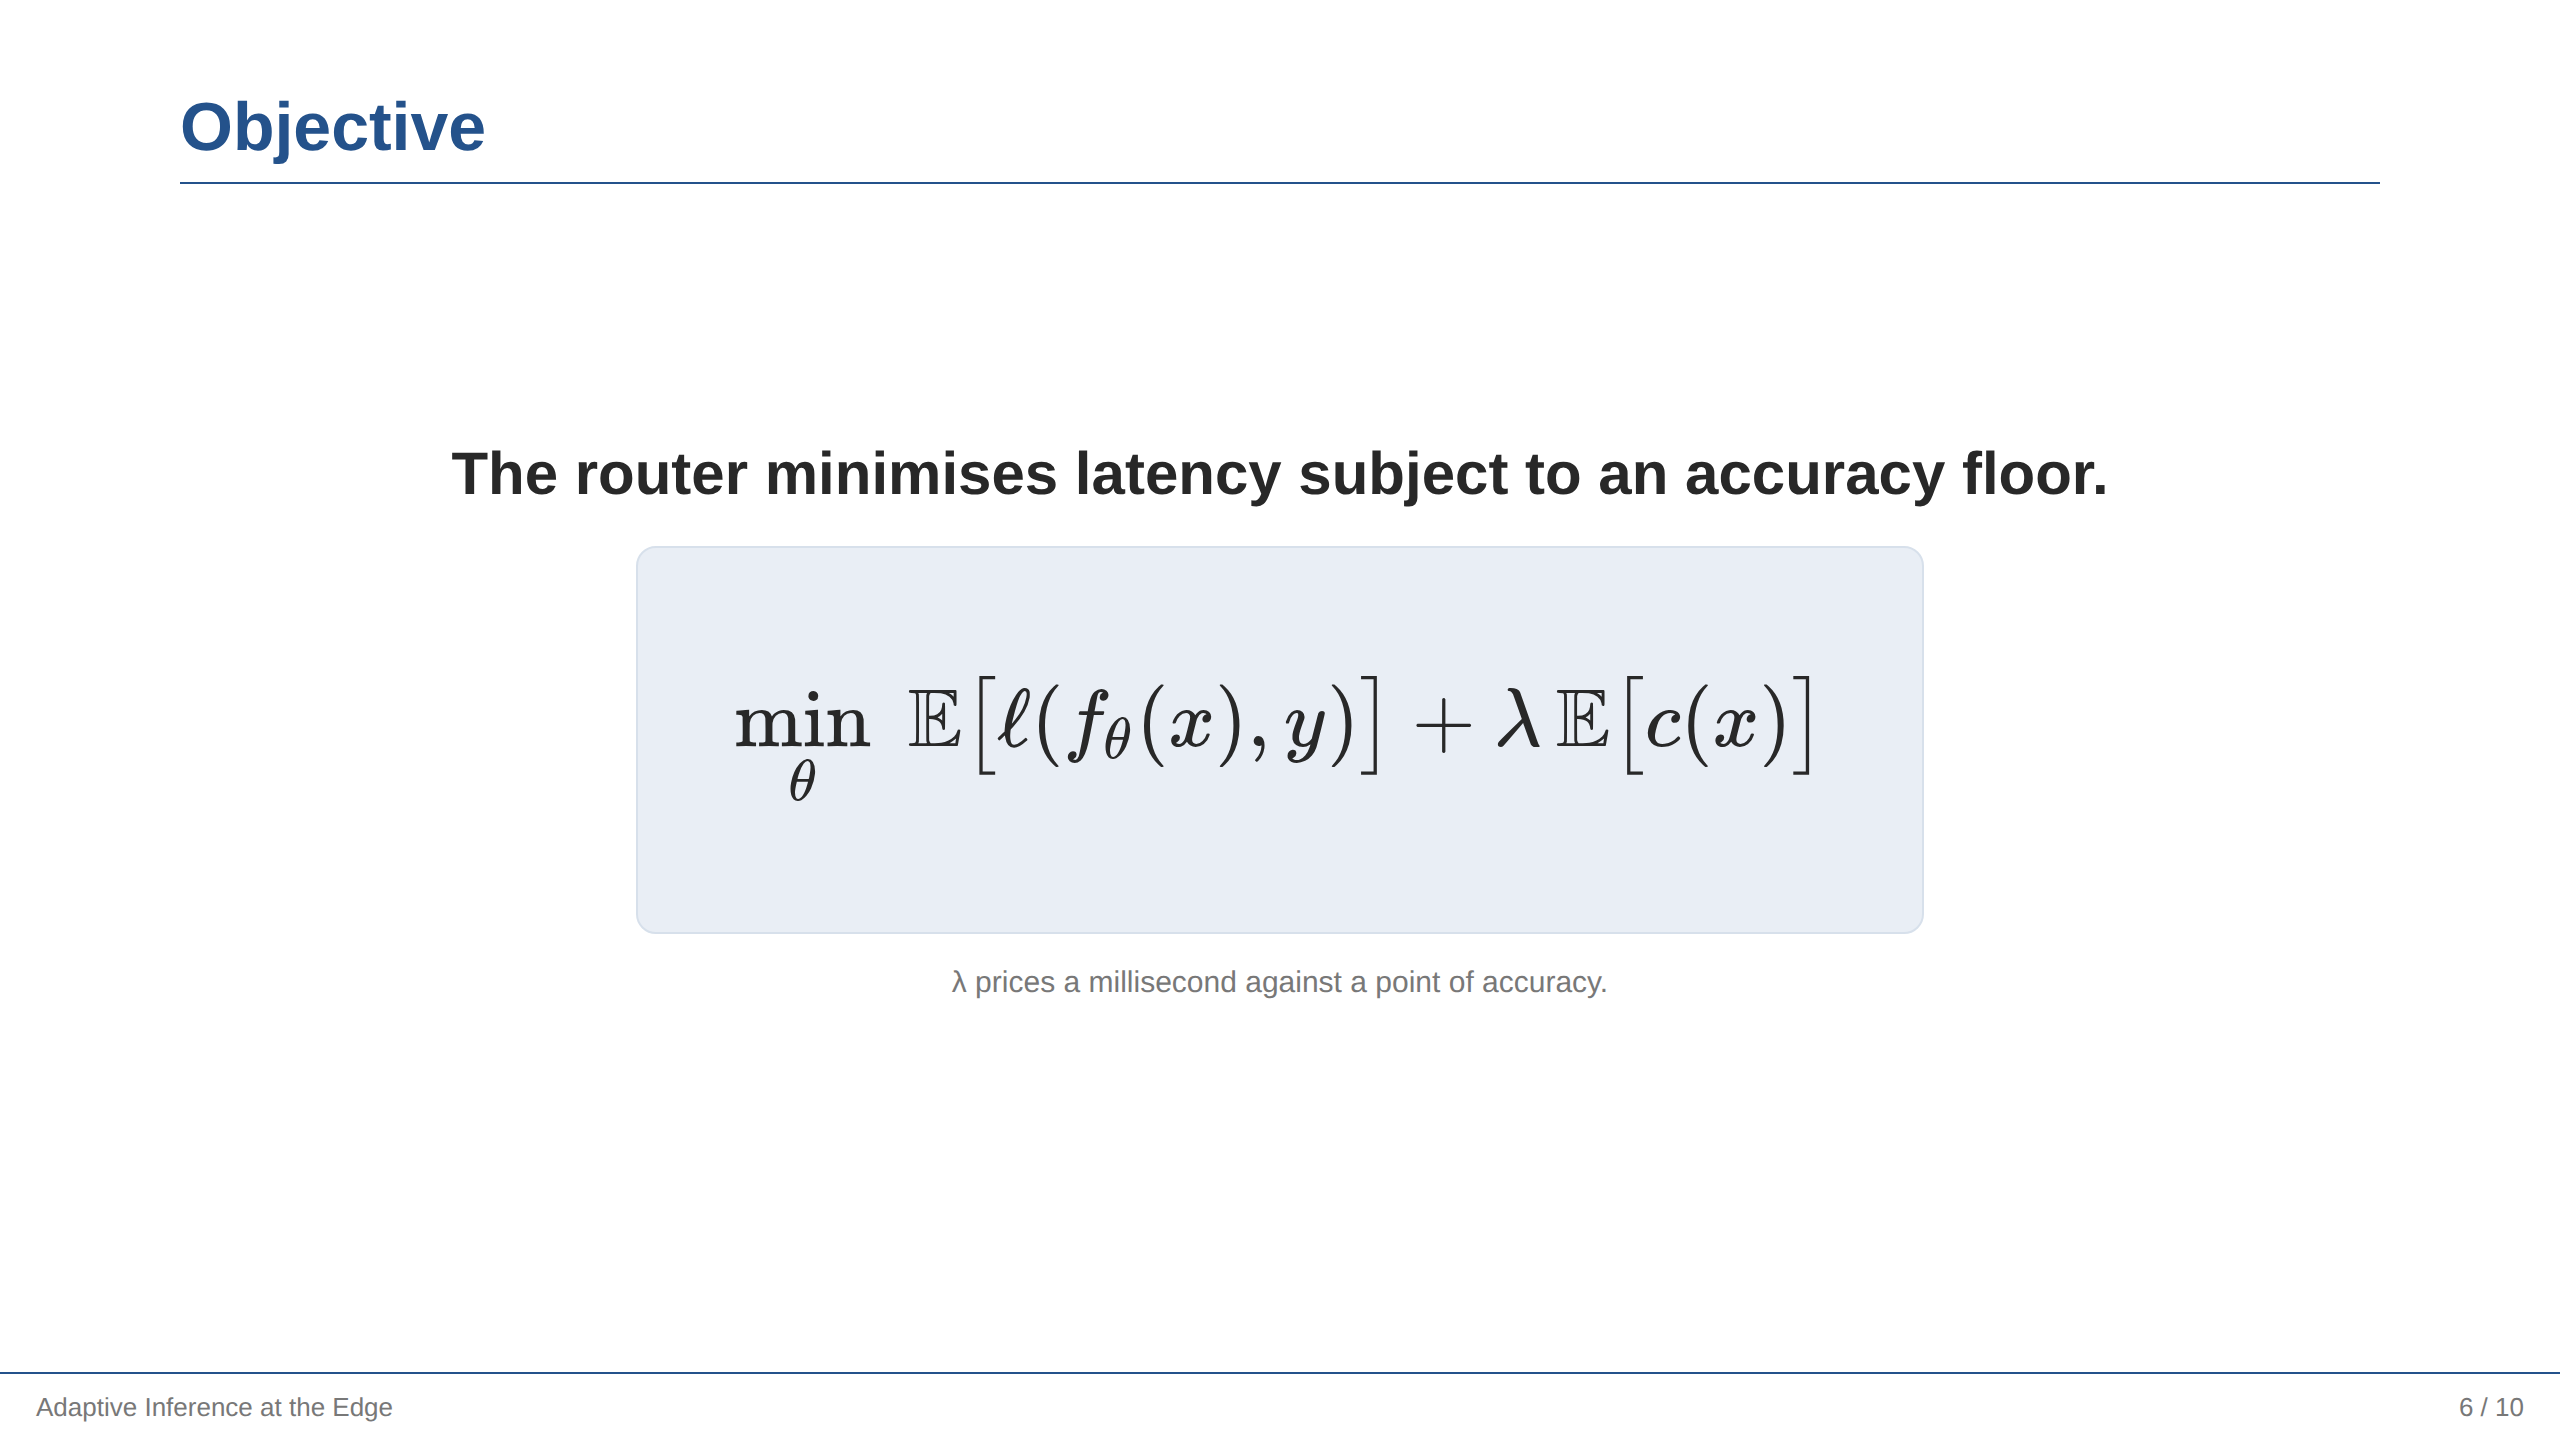
Use the tagged-template form for anything with backslashes. Sentence, formula, reading: the audience needs to know what the symbols buy before they parse them.
A flow diagram#
slide("Request path").canvas();

at("flow").row().gap(90).align("center").anchor("center");
shape("rounded", "Device").as("device").width(200).height(110).tone("teal");
shape("hexagon", "Router").as("router").width(200).height(110).tone("indigo", "solid");
shape("cloud", "Cloud").as("cloud").width(230).height(140).tone("sky");

line().from("device").to("router").arrow("end");
line().from("router").to("cloud").arrow("end");
text("28% of inputs continue past the router").caption().below("router", 28);
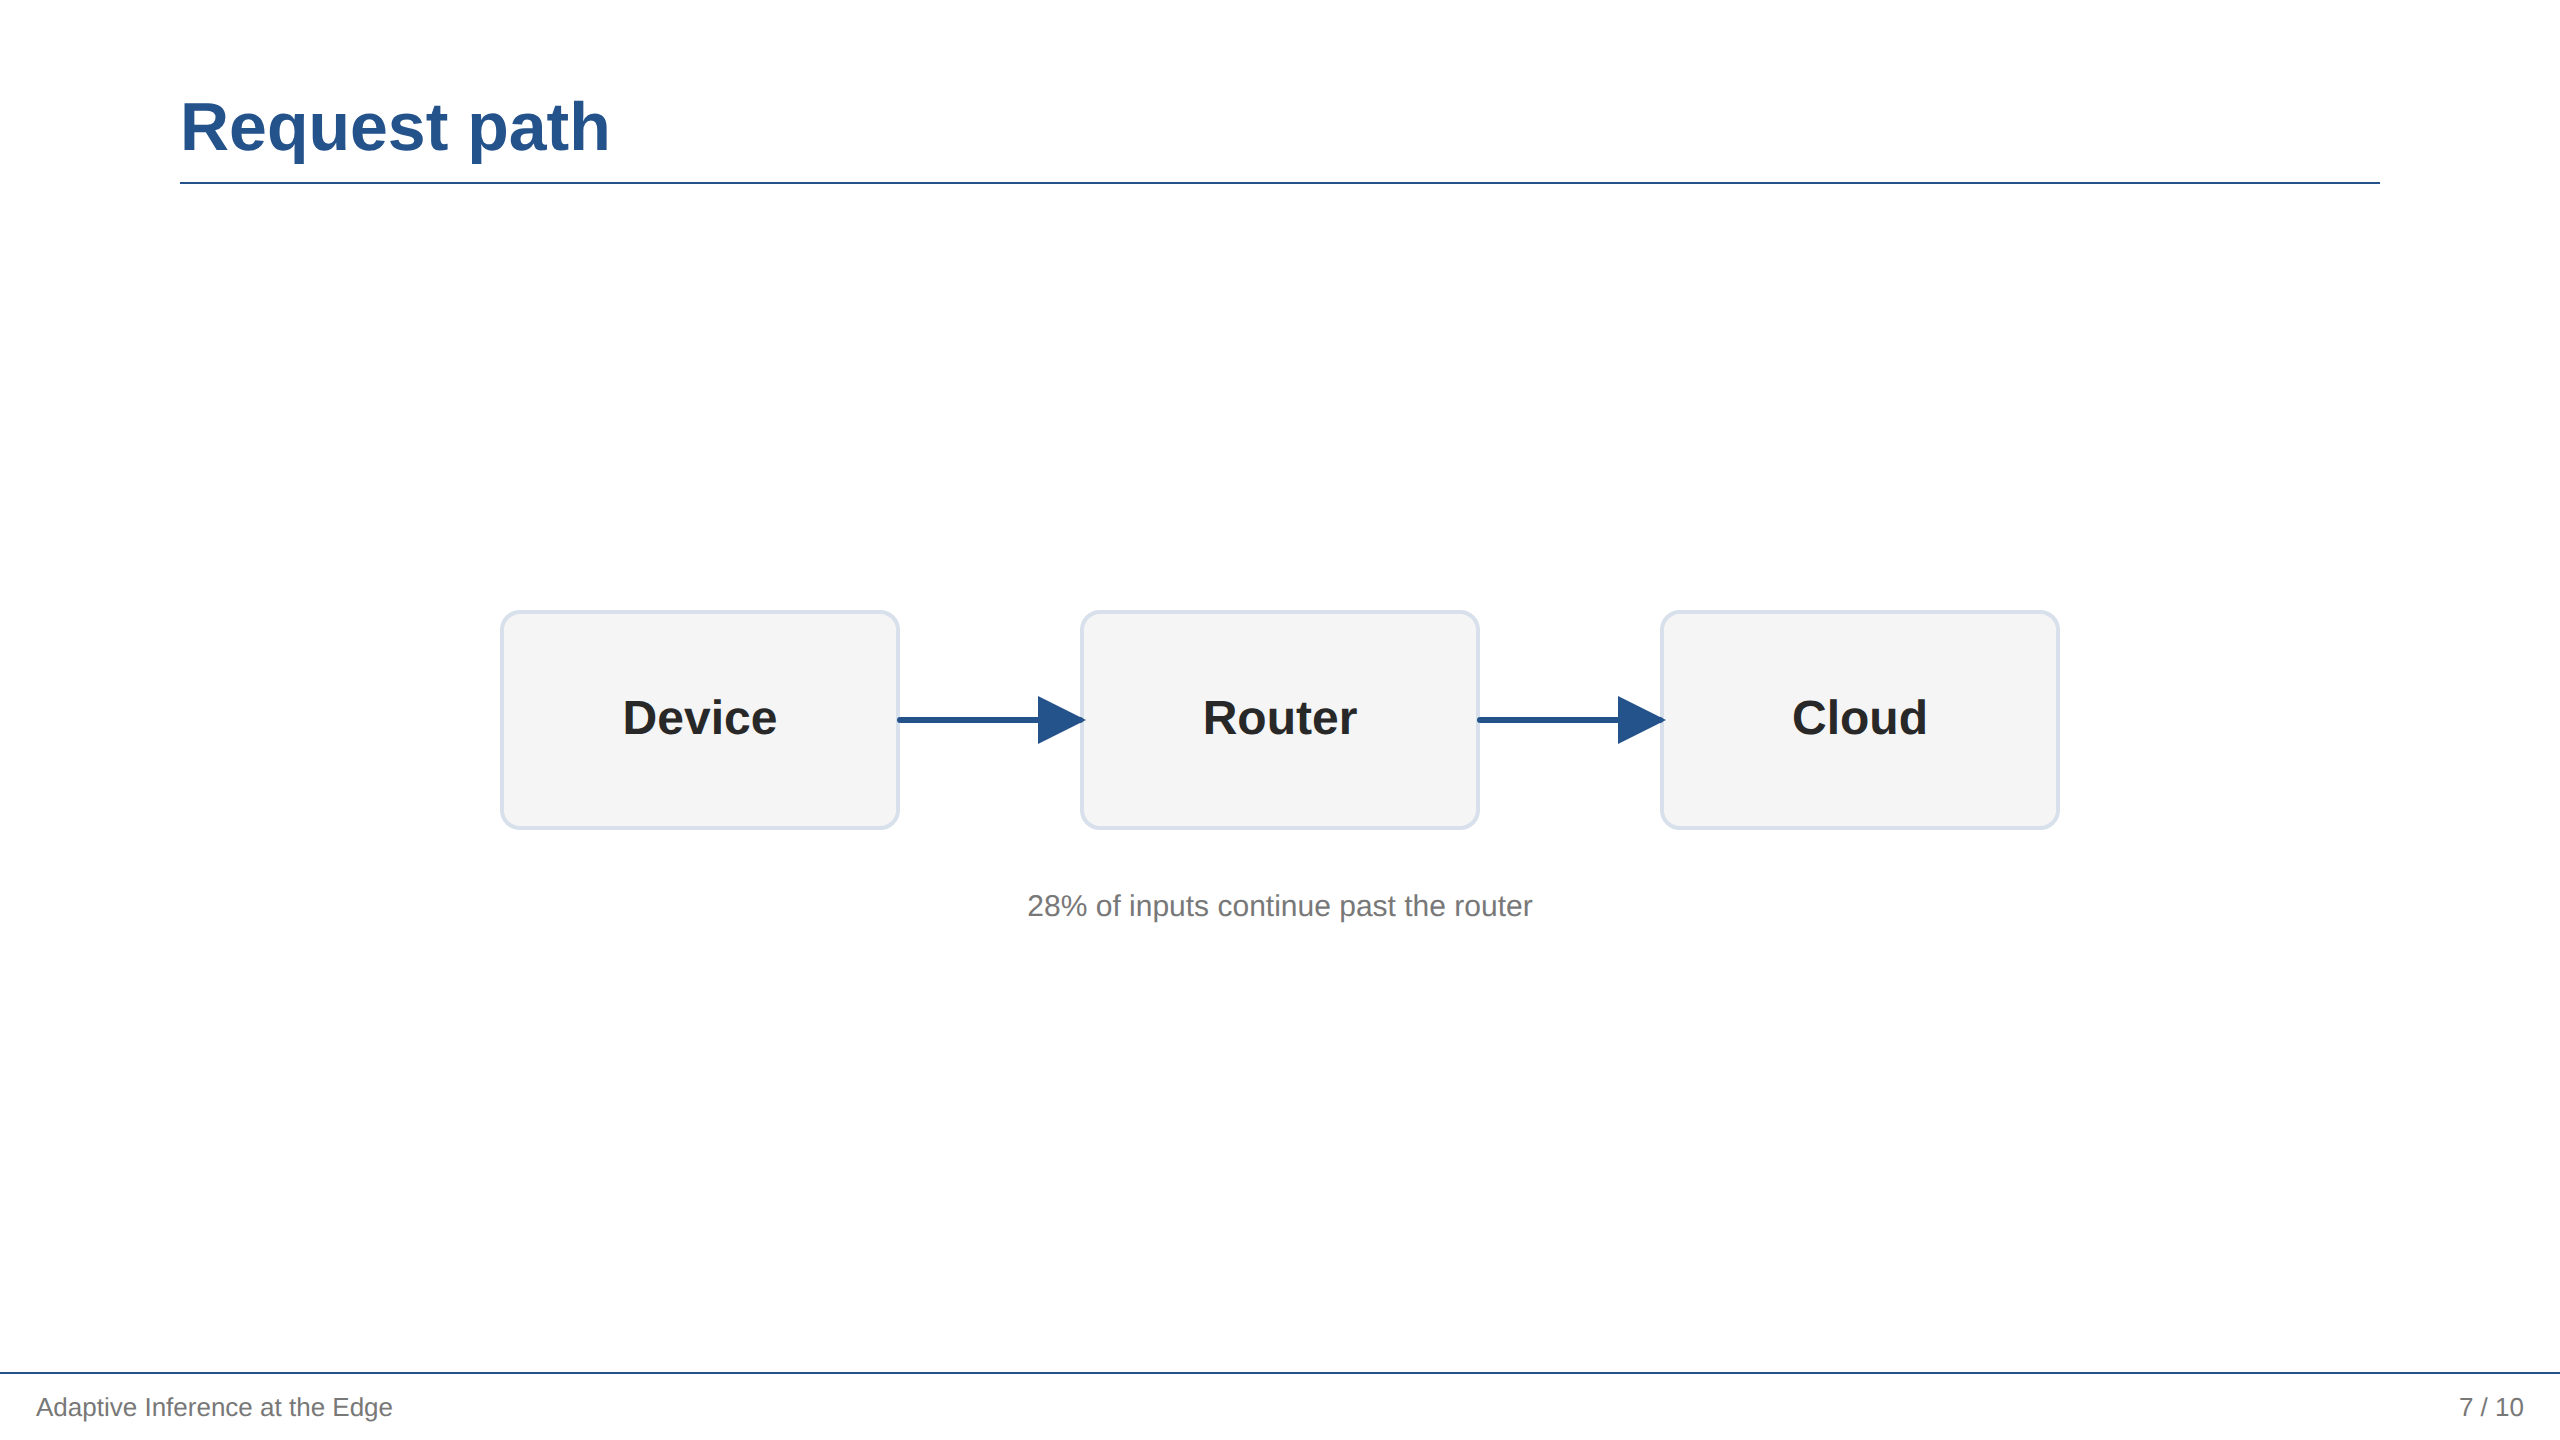
No coordinates. The row lays the shapes out, anchor("center") places the row, and the connectors follow the shapes. Changing gap(90) re-spaces the whole diagram, connectors included. Each node is the shape that says what it is, and tone() colours it by its role, so the router stands out as the one solid shape. See Diagrams for the full model.
A two-dimensional architecture#
slide("Where the work happens").canvas();

at("map").column().gap(64).anchor("center");
at("map/device").row().gap(90);
shape("rounded", "Small model").as("small").width(230).height(110).tone("teal");
shape("diamond", "Confident?").as("confidence").width(230).height(110).tone("amber");
at("map/cloud").row().gap(90);
shape("rounded", "Large model").as("large").width(230).height(110).tone("purple");
shape("cylinder", "Cache").as("cache").width(230).height(110).tone("purple");

at("map");
line().from("small").to("confidence").arrow("end");
line().from("confidence.bottom").to("large.top").route("elbow").arrow("end").label("no");
line().from("large").to("cache").arrow("both");
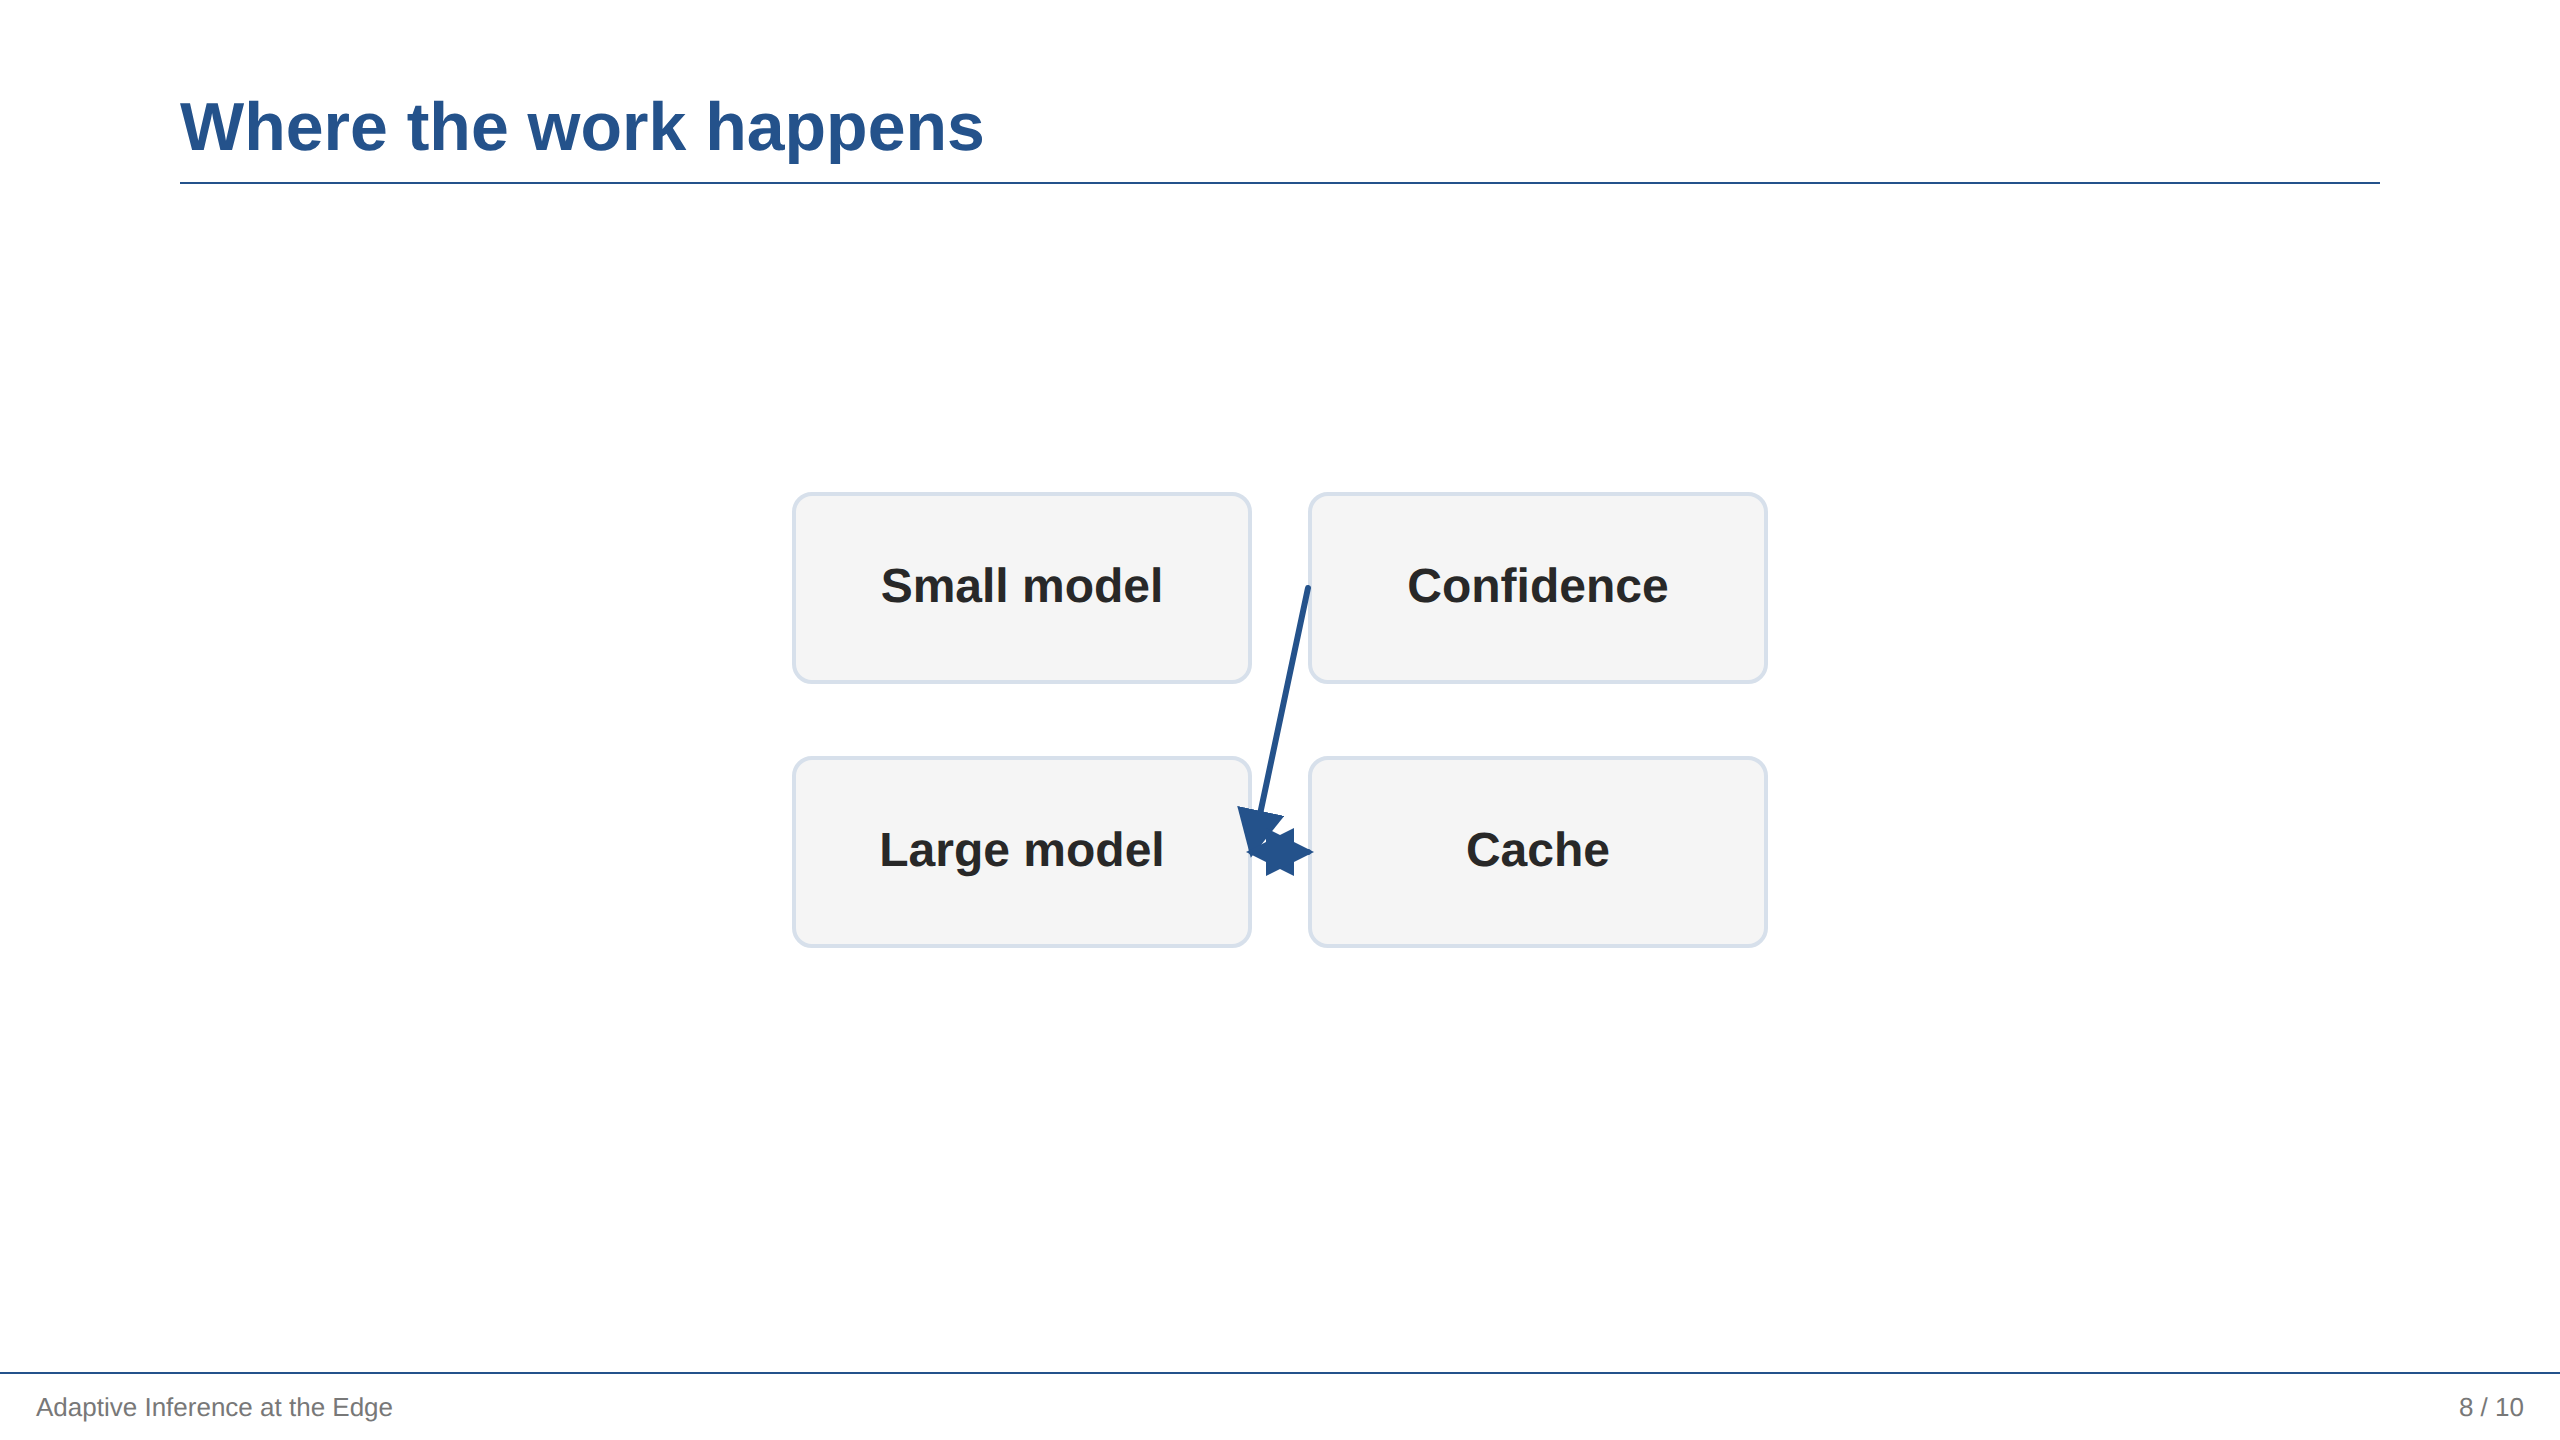
Rows nested in a column give the second dimension, and the path is the nesting. Return to the outer container with at("map") before writing the connectors, so their coordinates belong to it.
A decision flowchart#
slide("Answering a request").canvas();

at("flow").column().gap(40).align("center").anchor("center");
shape("pill", "Request").as("start").width(200).height(56).tone("green", "solid");
shape("diamond", "Cached?").as("cached").width(220).height(110).tone("amber");
shape("rounded", "Run the model").as("run").width(240).height(72);
shape("cylinder", "Store the answer").as("store").width(220).height(100).tone("purple");

at("flow");
line().from("start").to("cached").arrow();
line().from("cached").to("run").arrow().label("no");
line().from("run").to("store").arrow();
line().from("cached.right").to("store.right").route("elbow").arrow().label("yes");
A pill starts the flow, a diamond asks the question, and a cylinder keeps the answer. The "yes" branch is an elbow: it leaves the diamond's right corner, runs past the box below it rather than through it, and enters the store from the side. label() names each branch where it leaves.
Progressive reveal#
slide("What changed").notes("Pause after each step; the third is the surprising one.");
steps(
  "Latency fell by 65% for routed inputs",
  "Accuracy moved by less than one point",
  "The threshold, not the model, carries the trade-off",
);
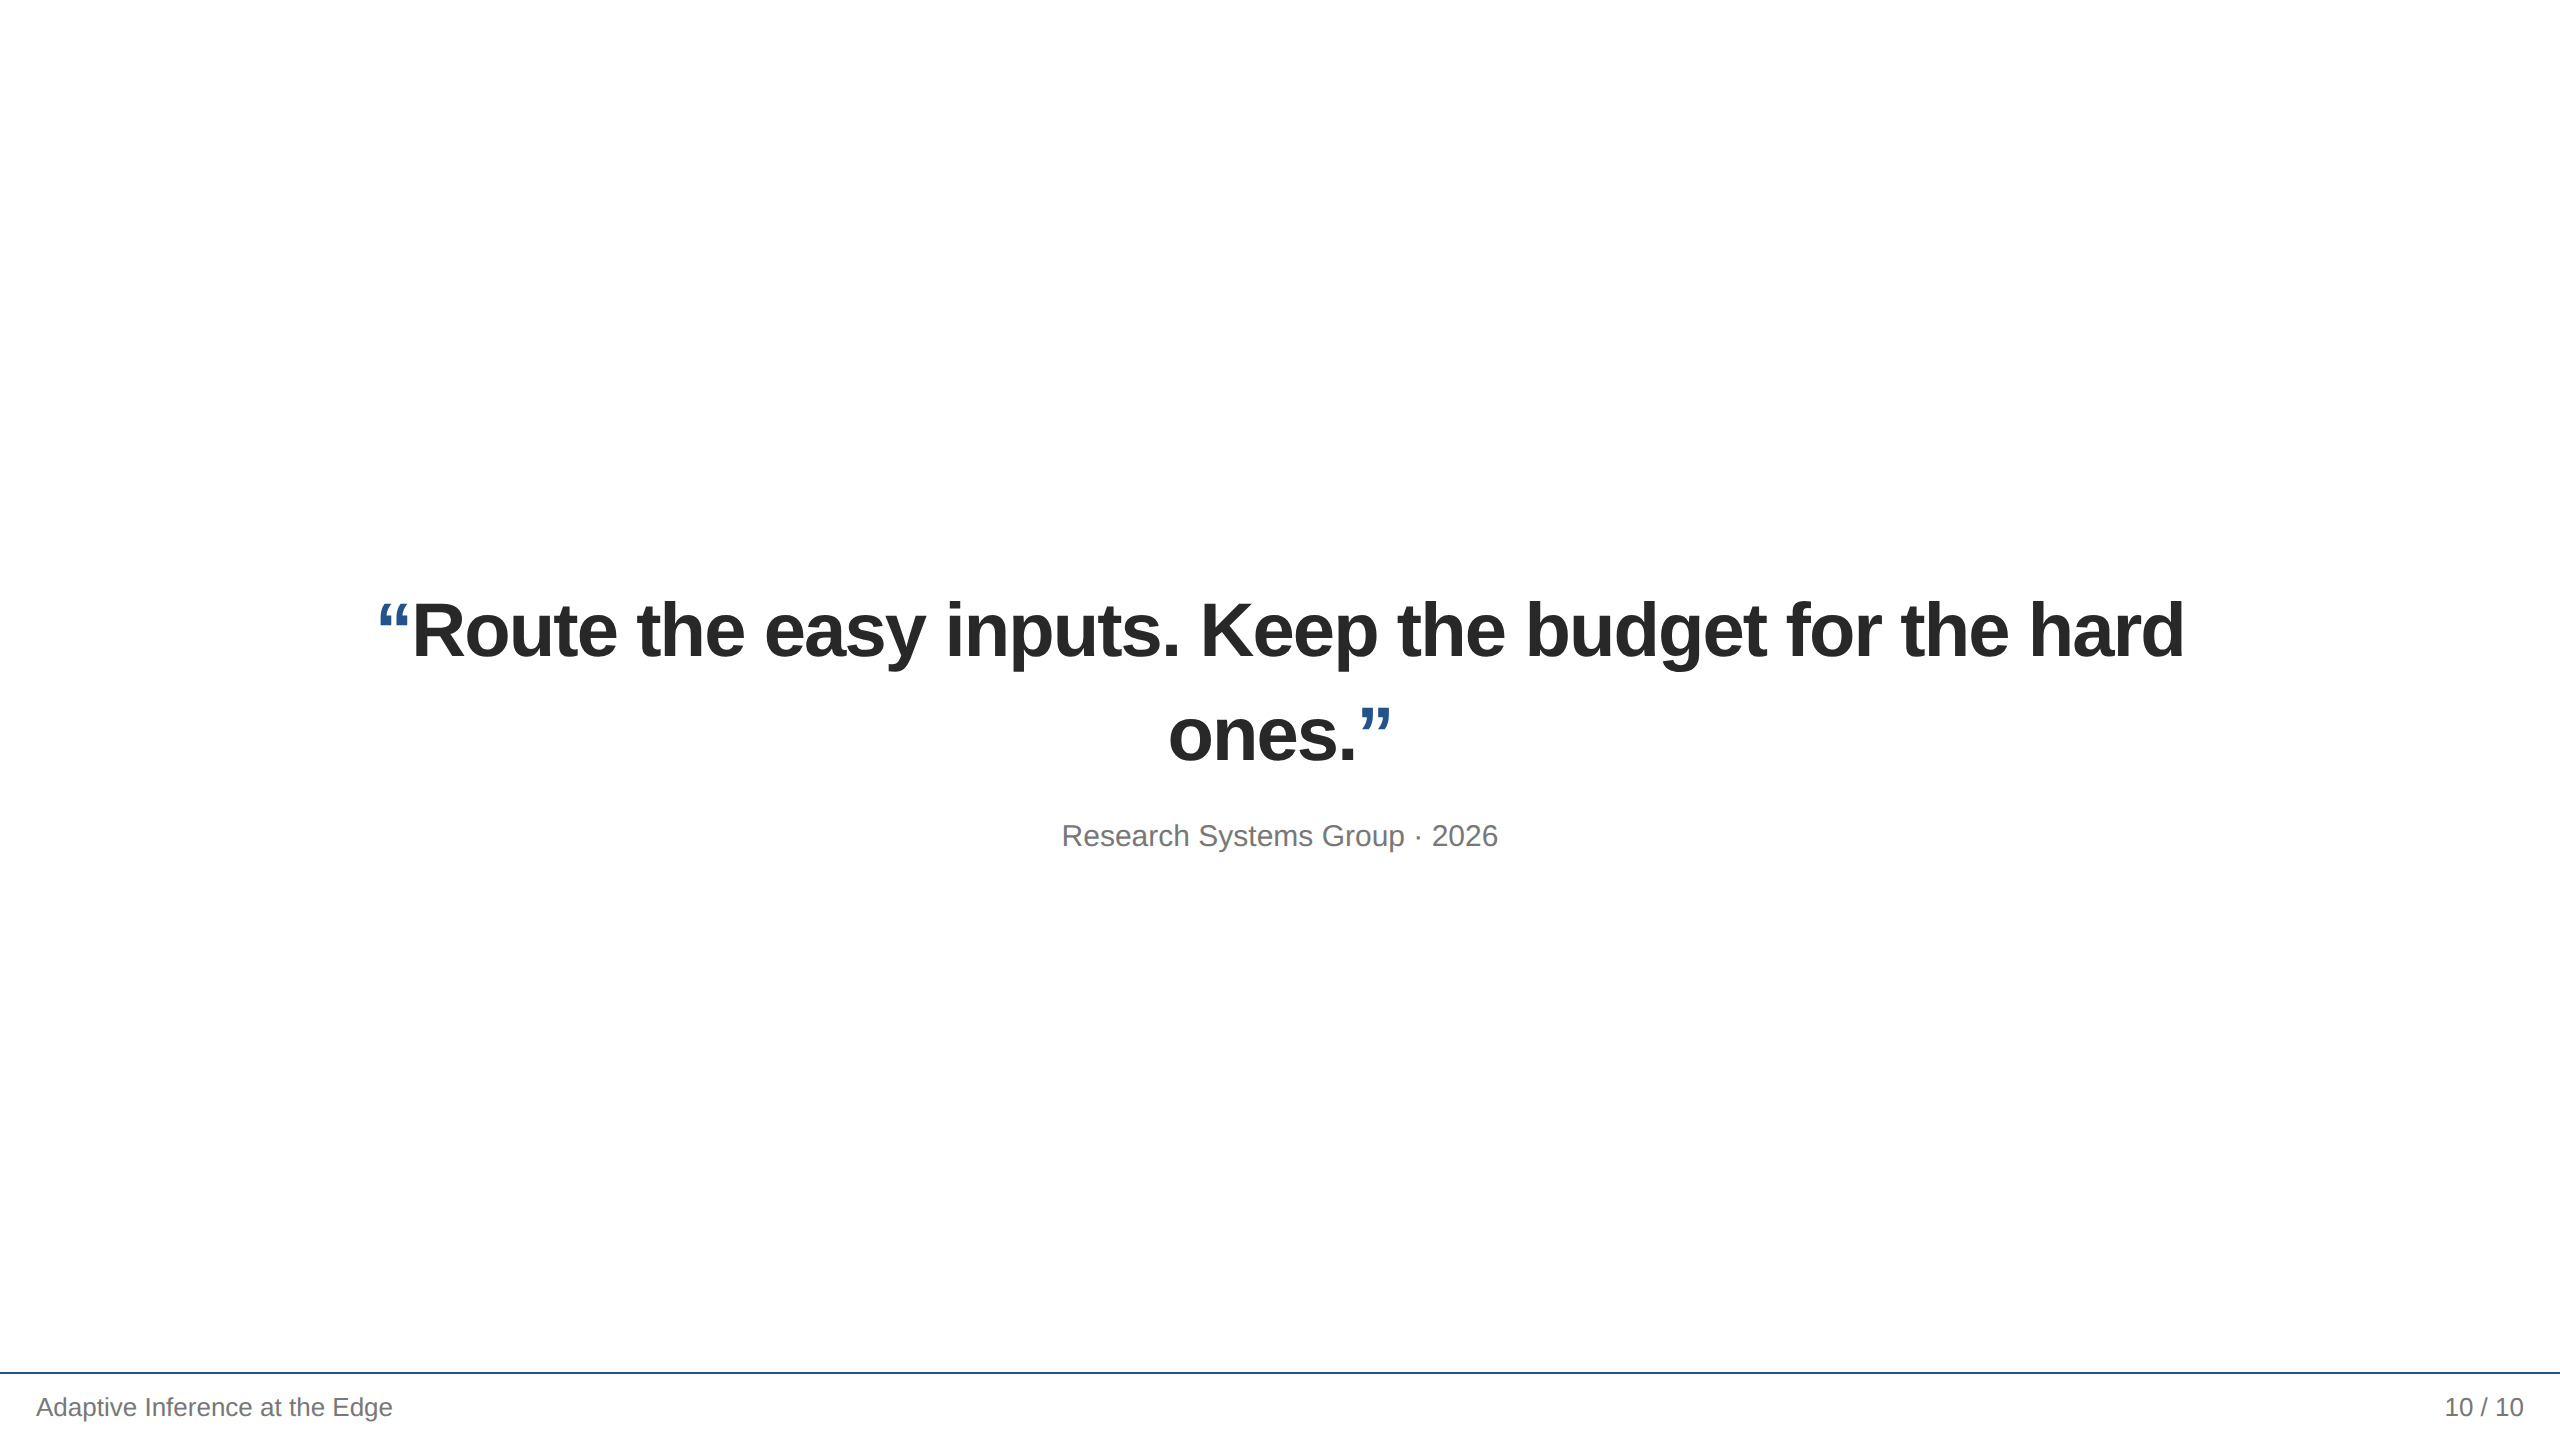
steps() reveals one item per keypress in the browser and shows everything in PDF and PPTX. Use showAt(n) when an individual object, rather than a list item, belongs to a step.
Closing statement#
slide({ name: "Close" }).center();
text("Route the easy inputs. Keep the budget for the hard ones.").quote();
text("Research Systems Group · 2026").caption();
A closing slide with one sentence gives the room something to hold on to. center() and quote() do the rest; the object form of slide() leaves the page without a heading.
Revising them#
Revising a talk takes these same slides through the edits a second draft needs — a theme change, a page split, a new measurement, a new node in a diagram — and shows what each one costs in lines.
Checking your own slides#
The slides these recipes come from pass the layout checker, and yours can be held to the same standard:
npx frameseq check my-talk.slides.ts
It renders every slide at its real size and reports text that overflows or is clipped, type below a readable size, empty slides, and mistyped region paths. See Layout checks.